: part 1")
A tire study has investigated if there can there be a good agreement between rolling road and real road measurements
Abstract/summary
This study compares the sound pressure levels found inside a tire and inside the vehicle cabin for a variety of road surfaces and speeds.
When a tire is fitted to a driven axle and then an undriven axle there is a 10dB difference in the SPLs measured inside the tire, but only when the tire is transmitting significant amounts of power. Primary cavity resonance (PCR) noise reduction measures should be preferentially directed toward tires fitted to the driven axle(s).
Tires fitted to undriven axles on the road show stable SPLs even when speed increased from 45mph to 65mph unlike when tested on a rolling road where SPLs always increase with speed.
The tire’s cavity noise level and frequency content are dependent on design (tread pattern) and the road surface texture. However, a well-maintained road will typically exhibit different aggregate mixes along its length and almost always at repaired sections; all these surface textures should conform to a strict specification. Provided the road contractor has complied with that specification it is likely that the tire’s internal SPL will vary by less than +/-2dB. Results from on-road measurements can normally be relied upon especially when the same stretch of road is used.
Stability of measured SPLs to within +/-1dB was found over a two-month period. For any tire test program that would benefit from genuine straight line running and need to achieve temperature equilibrium, the use of local major roads and motorways represents a viable solution.
Introduction
Making products that customers want is a shared objective. In the case of Bay Systems, it makes transducer systems that fit inside the tire, designed to deliver the accuracy and resolution needed, by tire and automotive R&D engineers, to understand and improve tire performance. These tire cavity modules (TCMs) measure noise, vibration and temperature to laboratory accuracy in the test cell, on the test track and most importantly, on the road.
Establishing the performance envelope for a tire is the first step in defining the testing regime that will be needed to validate the development. Early testing is usually completed in test cells, the test track used later, and then finally comes the road testing. Even where budgets are large it is very difficult for test cells to accurately replicate road and weather conditions. If these early test results, that are so important in proving the design, do not reflect real operating conditions then extra expense awaits when the rubber finally hits the road.
Track and road testing are where mathematical modeling and reality meet. To minimize risk, designing for the worst case might be the chosen path but such a path will risk adding delay and cost into every stage of the project. It is always more difficult for a design to reach more demanding targets. Difficulties encountered might be so severe that the project is cancelled. On the other hand, if the targets were correctly set then the project would follow an optimal path and deliver a tire at the lowest cost and in the shortest time.
TCM measurements provide data on how a tire operates on the road in real-life conditions. Benchmark data can be gathered using own and competing current generation tires and some sort of projection technique will be used to set the design goals and test parameters. Before the microphone version of TCM was launched in 2012, after a four-year development process, data on PCR levels for tires and road surfaces was not available. How were auto and tire engineers to set reasonable targets for something they could not measure? Accelerations were measured on suspension members and sound levels taken in the vehicle cabin. From these the tire’s PCR and general road noise performance was calculated. The sales success of TCM demonstrated that tire engineers were very keen to find out what the tire was really doing rather than rely on estimates based upon deconvolving vehicle transmission path data. Tire engineers need to be able to respond with hard data, on their tire’s performance, when auto makers requested a still quieter tire. In many cases high levels of PCR and road noise in the vehicle’s cabin are a function of tire and vehicle transmission paths, not just a tire ‘problem’.
Currently most testing with TCM is rolling road based. This is understandable, for reasons of convenience, but risks leaving a knowledge gap in fully understanding the mechanisms driving noise and cavity resonances. The dominant source of energy feeding into the cavity modes comes from the interaction of road and tire and this is not characterized accurately by running a tire on a smooth steel road wheel. Test track surfaces can match a broad cross-section of real road surface textures, including raised manhole covers and kerbs, but access to a test track must be negotiated and programmed. The ideal solution for development testing is to take data in the test cell and translate it to create the results that would have been taken on the road.
The first step in this translation/mapping process is to determine how well our current test cell- based results agree with the data from the tire operating on the road. The second step is to trial some mappings that may allow the test cell to produce road results within a tolerance. The third step is to use the developed translation/mapping to develop a new tire.
Results
The test vehicle was a Mazda BT-50 pickup truck, henceforth referred to as the truck. With two Imperial and two Nokian tires, the tires were not mixed on the axles.
The results presented here are from a study of variability in the level of the primary cavity resonance when running over different road surfaces. If real road data was found to contain wide and inexplicable variations, there might be no reliable way forward. For if the target cannot be reliably defined there is no hope of creating a translation or mapping function that can work. The objective of the work was constrained to what is considered ‘normal driving’, on the basis that this is probably what 95%+ of all tires experience and getting a good result over 95% of usage would be an excellent start. Test cases were local roads at 30-50mph (48-80m/h) and cruise on motorway and dual carriageway at 60-70mph (96-112km/h). In the UK, legal maximum speed is 70mph. The results from the road are then compared with results from a 1.7m diameter steel road wheel.
PCR tone
The PCR couples, through the rim, to the axle and eventually appears in the vehicle cabin as a potentially annoying tone. PCR appears around 200Hz for most 17in tires, only slightly below middle C (256Hz), as such the PCR is reduced in level by 11dB when A weighting is applied to align its level with the human perception. If the PCR tone were at 1.6kHz one would be in serious trouble as the human ear and hence the A weighting curve is 12dB higher at 1.6kHz than at 200Hz. The presence of the PCR tone and road noise is masked in many vehicles by diesel powertrain noise, which generates firing order harmonics inside the cabin, which can be in excess of 100dB unweighted. These very high levels effectively desensitize the human ear even though the occupants are barely aware of them (reference 1). Electric vehicles will have no ‘helpful’ powertrain noise and the PCR tone might, for many vehicles, be easily heard and a very annoying noise especially if it occurs at a speed often driven at.
Testing program: Characterizing the difference between driven and undriven wheels
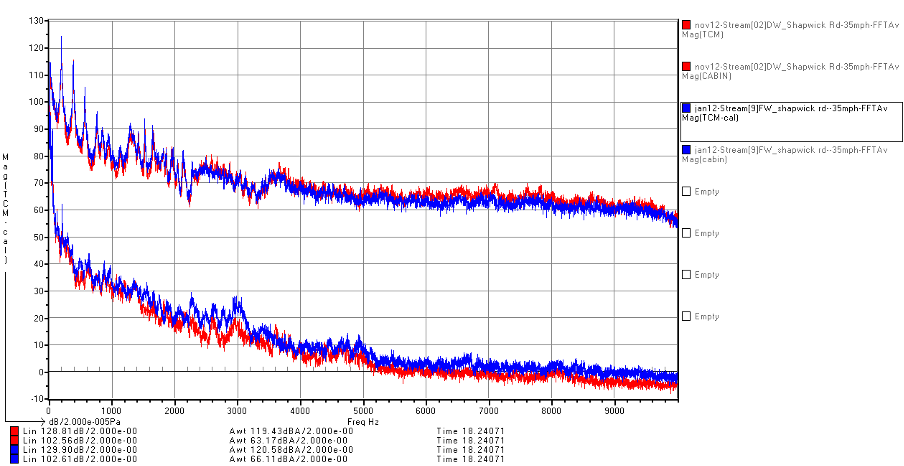
Driving on a straight road at low speed (35mph) on a slight downward incline and consequently with very light throttle there should be almost no power to the driven wheel and therefore differences between driven and undriven tires should be minimal. The data presented in Figure 1 compares noise spectra from the rear driven wheel (DW) with the front undriven free wheel (FW).
The spectra recorded from inside the tire show good agreement between DW and FW. The in-cabin levels were recorded for both DW and FW tests and should be identical provided the front and rear axle isolation and the tires are identical. The difference in overall linear levels were within 0.1dB for the cabin and within 1.1dB for the tire cavity. The lower traces in each figure are from the cabin microphone. The results are in good agreement confirming the hypothesis that very low power flow through a tire does not increase internal noise over the free wheel case.
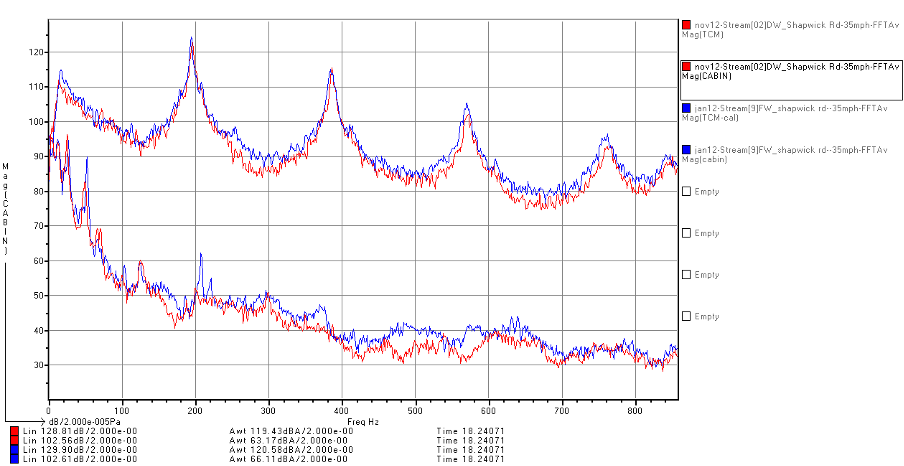
The primary cavity and higher mode resonances (Figure 2) were essentially identical between the driven and undriven wheels for these two recorded ‘streams’. The measurements were on the same road, two months apart, at the same ambient temperature and at the same distance from a cold start. The doppler shifted primary cavity tone is visible in the cabin data at 209Hz but was inaudible to the driver. One Nokian had the TCM and the other Nokian had a TCT fitted. If the Imperials or the Nokians generated higher PCR levels and the trucks front/rear isolation was different, then the PCR tone would be more prominent in the cabin when the higher PCR tire was fitted to the axle with lower isolation. When the Nokians were on the front axle, the PCR was 10dB higher in the cabin, confirming that there was a difference between tires and/or transmission path efficiencies.
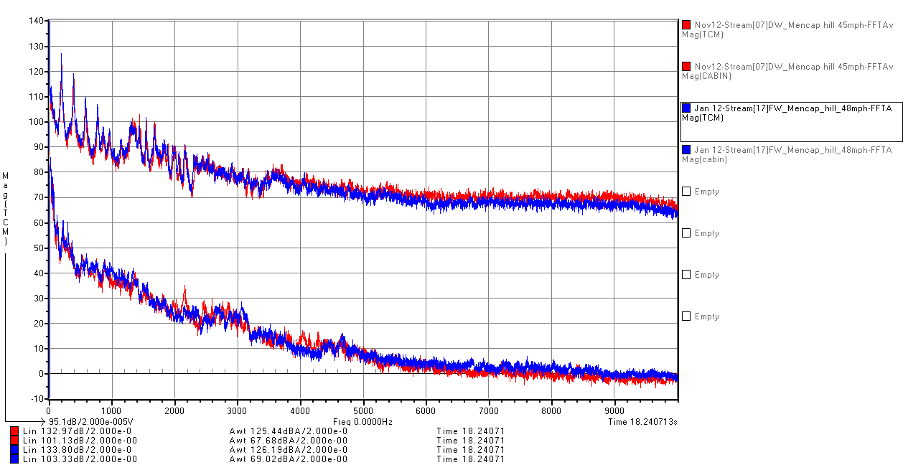
Driving at a 45-48mph (75km/h) and climbing an incline of approximately 1:20 the driven wheels were now doing more work than the undriven wheels. The measurement (Figure 3) does not however show a higher spectrum level or cavity resonance peaks for the driven wheel, rather the undriven wheel was 1dB higher. The cabin levels for the two recordings agreed to within 2dBA in overall level. What had changed as the speed increased from 35mph to 45mph was the overall linear spectrum level inside the tire cavity, this increased from 129dB to 133dB, a 4dB increase. The cabin overall linear noise level did not change but the overall Awt level did increase by approximately 3dBA. This result is indicative in a change in the balance of low and high frequency content.
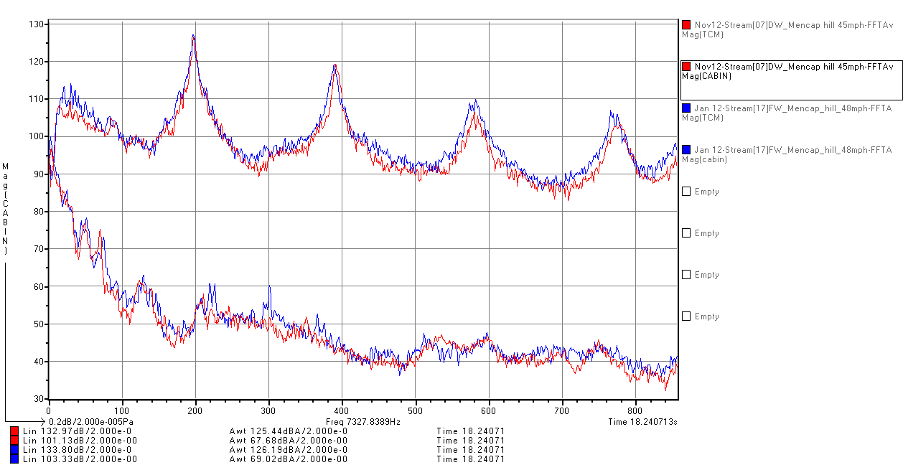
Looking more closely at the cavity mode levels (Figure 4), the agreement between the first two resonant modes is almost perfect i.e. DW = FW. For the higher cavity modes DW is 3dB lower in level.
In the next instalment: Cruising on the M5 motorway
*Indicated speeds were +3mph more than the actual speed reported by GPRS navigation. All speeds reported in this note are indicated speed. The TCM was always inside the Nokian tire, the tires moved from back on November 12 to front axle on January 12.


